


Expertise

From the early pioneers on the Snowy Mountains Hydroelectric Scheme, to our leaders and innovators of today, our people make us who we are.
Through our network of global specialists and by collaborating with local partners, we connect you with the best teams and capabilities to deliver highly innovative and sustainable solutions.
As an organisation we are continually evaluating ways we can better provide a safe, flexible, inclusive and respectful workplace for our people and clients.
People are at the heart of our organisation, we strive to create a flexible, diverse and inclusive environment that enables our people to thrive to their fullest potential.
Explore career opportunities
At the Marine Drive Expressway, Bangladesh, SMEC’s integration of GIS and web GIS platforms has not only improved efficiency and accuracy but also enhanced collaboration, communication, environmental management, and sustainability. By leveraging the capabilities of GIS, stakeholders can ensure the successful implementation of expressway projects while minimizing social and environmental impacts.
Below we take a deeper dive into five value adds that SMEC delivered during the projects preliminary design stage.
The GIS provided a centralised platform that facilitated data analysis, visualization, and efficient collaboration. This played a pivotal role in enhancing decision-making processes and improving communication between teams.
One notable example is the engagement with the Forest Department Bangladesh. The project team actively collaborated to ensure alignment decisions met the department’s existing and future forestry plans along the road corridor. GIS, particularly web GIS, served as a comprehensive platform for sharing and analysing data, enabling stakeholders to gain a holistic view of the project’s impact.
Detailed GIS data also proved beneficial for specific project aspects, such as bridge planning and obtaining navigational clearance from the Bangladesh Inland Water Transport Authority. GIS pinpointed bridge locations and associated land information, helping estimate distances and chainages of embankments from water level gauge stations.
The web GIS platform served as a centralised hub where stakeholders contributed data to the GIS team, who then processed and uploaded the information for seamless accessibility. This encompassed a wide range of data, including existing and planned capital works programs, interfacing projects, area boundaries, drone image orthomosaic pictures, land patterns, resource collection points, and disaster-prone areas. Through this platform, team members had real-time access to data updates, empowering them to align their work accordingly.
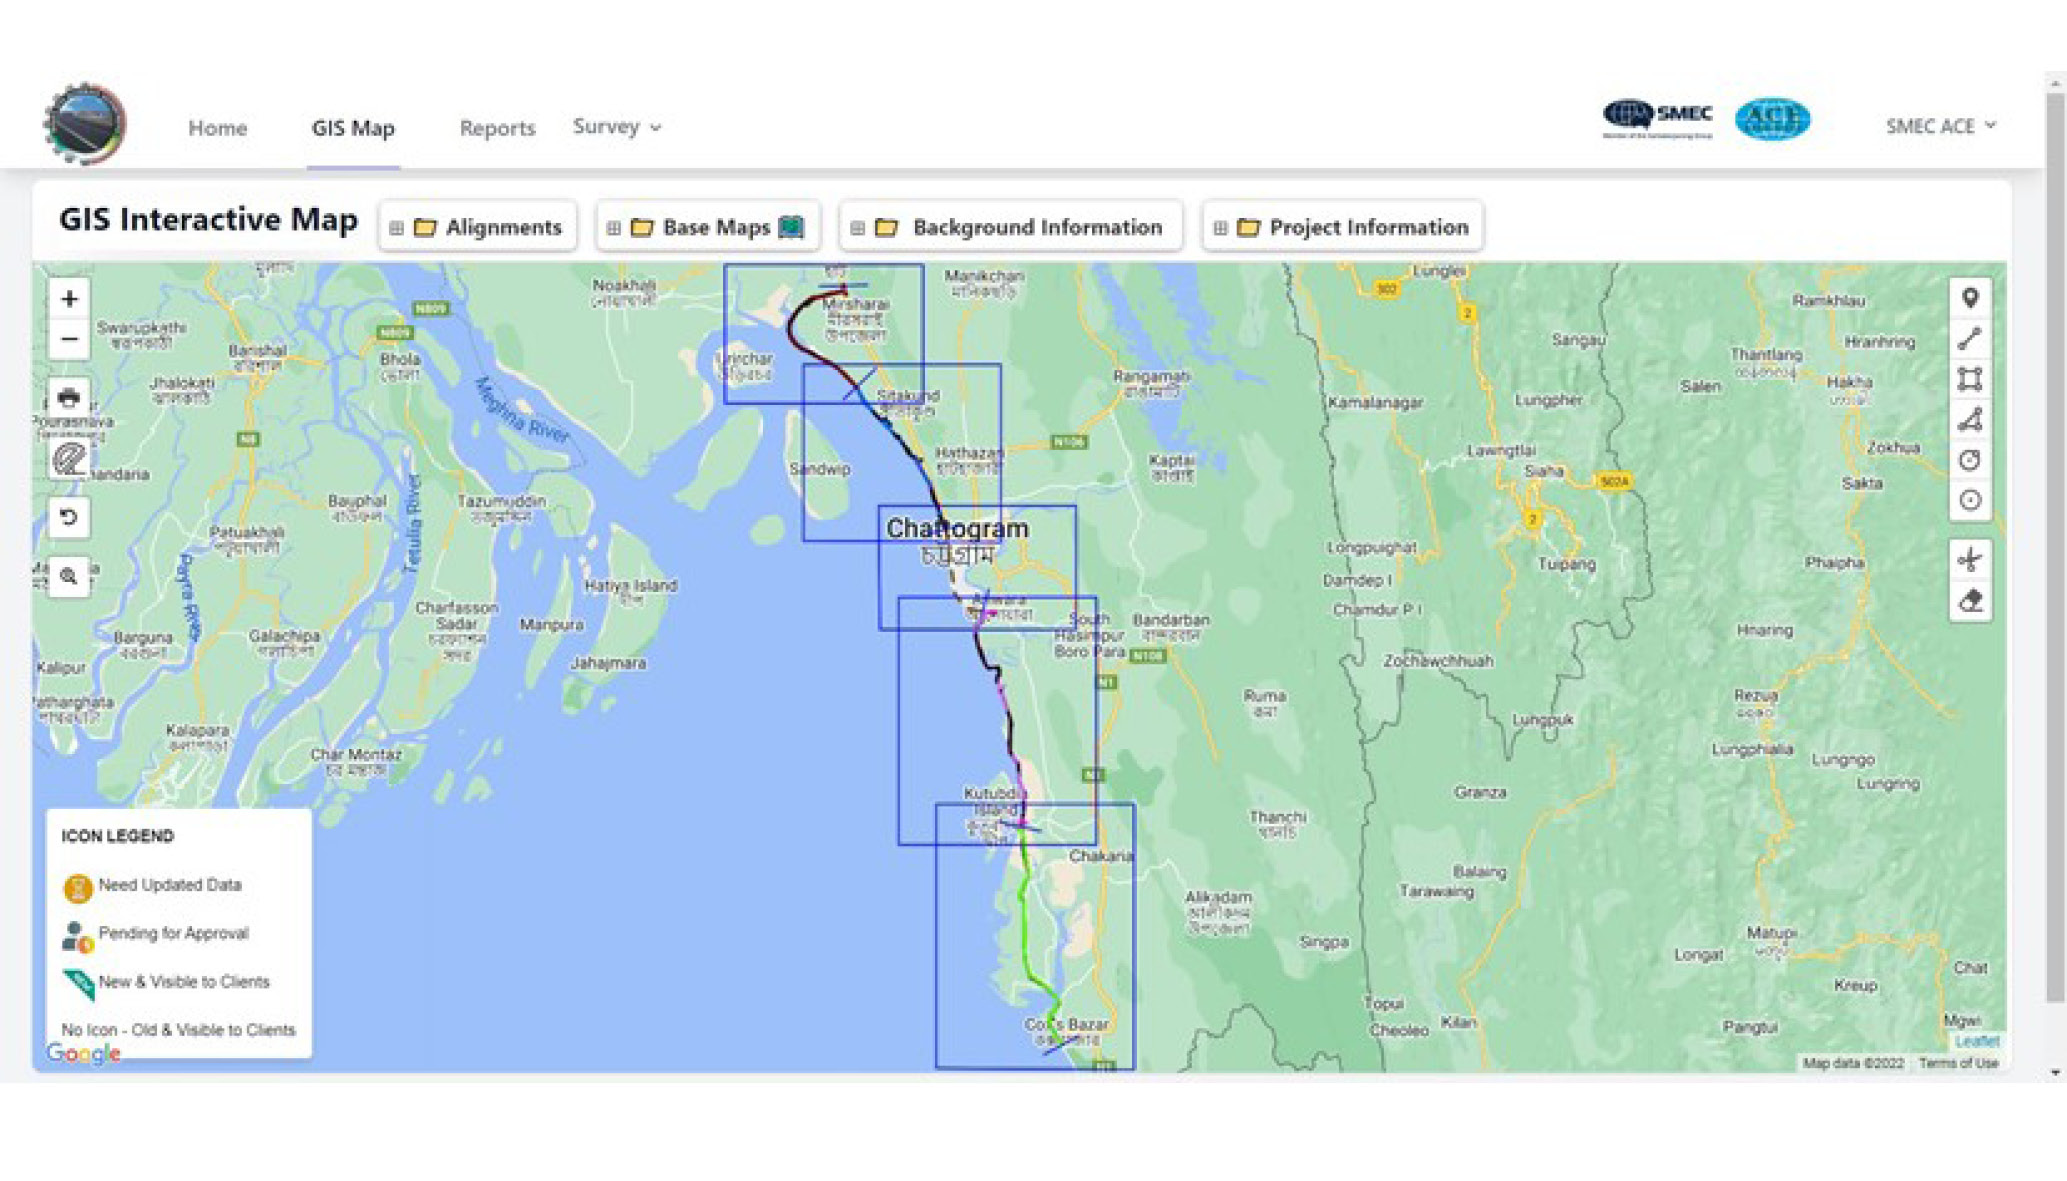
The web GIS solution played a pivotal role in visualizing social, environmental, and structural information, providing clients and stakeholders with practical field insights from anywhere. They could easily explore and compare various alignment options, track version changes, assess land acquisition requirements, and evaluate space utilization in stakeholder plans. Additionally, the implementation of a digital report submission system within the web GIS platform streamlined the process of accessing and downloading submission reports.
Traffic surveys played a crucial role in gathering information and data related to road usage and traffic congestion. By integrating GIS data with traffic modelling, the project team has gained valuable insights into traffic behavior, enabling SMEC to make informed decisions regarding road design, capacity planning, and optimisation.
The synergy between GIS and traffic surveys enabled the project team to develop comprehensive and accurate traffic models. These models assisted in understanding the current traffic conditions, predicting future demands, and identifying potential bottlenecks or areas requiring improvement.
For traffic-related considerations, GIS supported road network analysis, including traffic surveys, road categorization, and traffic zone boundary fixation for city traffic surveys. Road inventory work was also efficiently conducted through GIS applications.
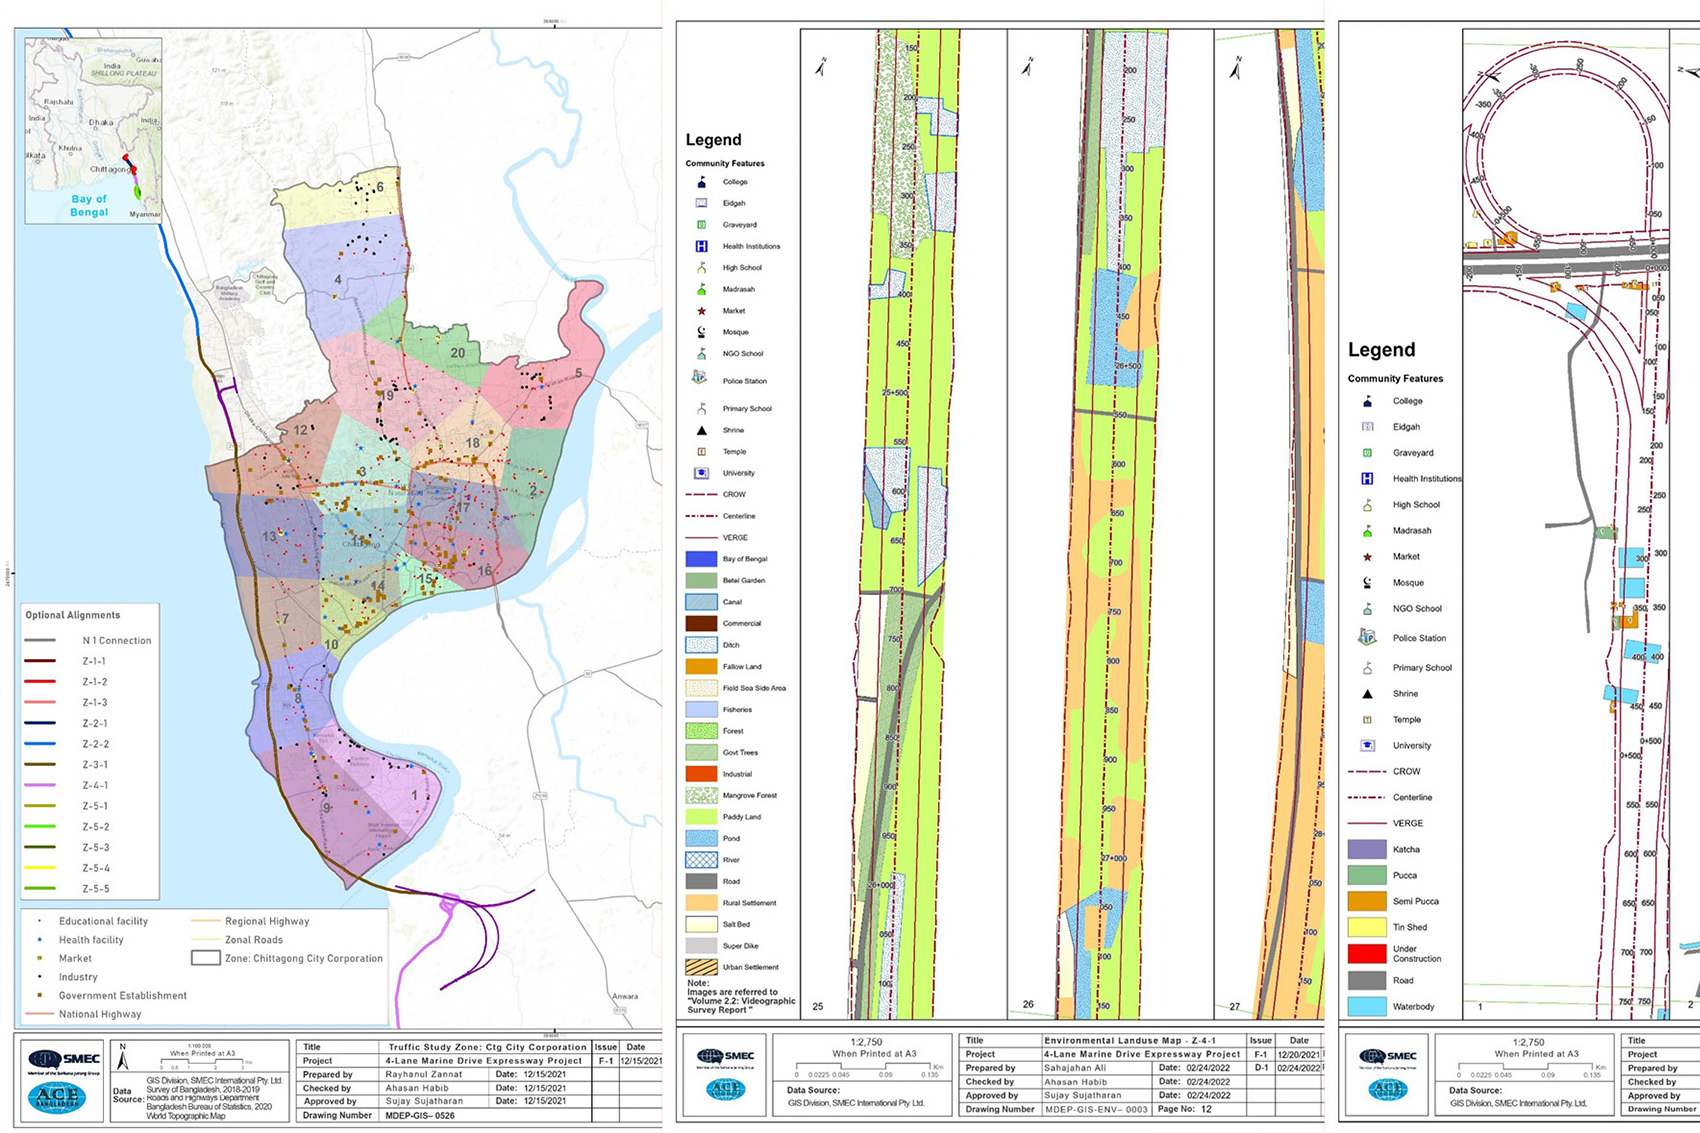
Land acquisition is a complex task in any development project, but the implementation of GIS has helped to streamline and simplify the process. In the case of the Marine Drive Expressway, GIS technology played a pivotal role in informing the land acquisition process through a series of five steps:
The land area for each type of land was calculated using ArcGIS, enabling precise determination of the area associated with each land category. Finally, the unit cost was multiplied by the land area to obtain the final cost of land acquisition.
By integrating GIS technology into the land acquisition process, SMEC was able to enhance accuracy, efficiency, and transparency in determining land classifications calculating costs, and establishing a comprehensive land acquisition strategy.
Hydrography surveys supported data-driven decision-making, visualisation of water conditions, assessment of water circulation, consideration of environmental factors, and mitigation of risks. Key applications included:
In the Marine Drive project, culverts are planned at intervals of 500 meters to ensure effective water drainage. Utilising the complete GIS procedure enhances the applicability and precision of culvert placement decisions. The following methods have been applied:
Complex highway projects require meticulous planning and consideration. At SMEC, Geographic Information Systems (GIS) technology has emerged as a powerful tool, adding value for our clients and partners across all stages of the project lifecycle as well as ongoing asset management.
It was an exciting Saturday in April 2019 as the Canberra Light Rail, after more than a decade in planning and construction, opened its doors to the public. It’s the first light rail system for Australia’s capital and a key element of the Australian Capital Territory (ACT)’s Government’s Canberra Plan, a strategic guide to the city’s future growth.